Trend Graphing
I. Introduction
The Data Graphing feature allows for the visualization of both current and historical data.
II. Creating a Trend Graph
- Select either the Historical Data Graph or Real Time Graph tab located at the top of the form
- Select the Group for the desired tag from the Group dropdown box
- Select the Tag Description for the desired tag from the dropdown Tag Description box
- Click the Add button located to the right of the Tag Description to add the tag to the graph
- Repeat the above steps to add additional pens to the graph (a maximum of 16 pens is allowed)
- Click the Remove button to delete the last pen added to the graph
- Click the Clear button to delete all pens from the graph
- Click the Refresh button to redraw the graph and include the most current data
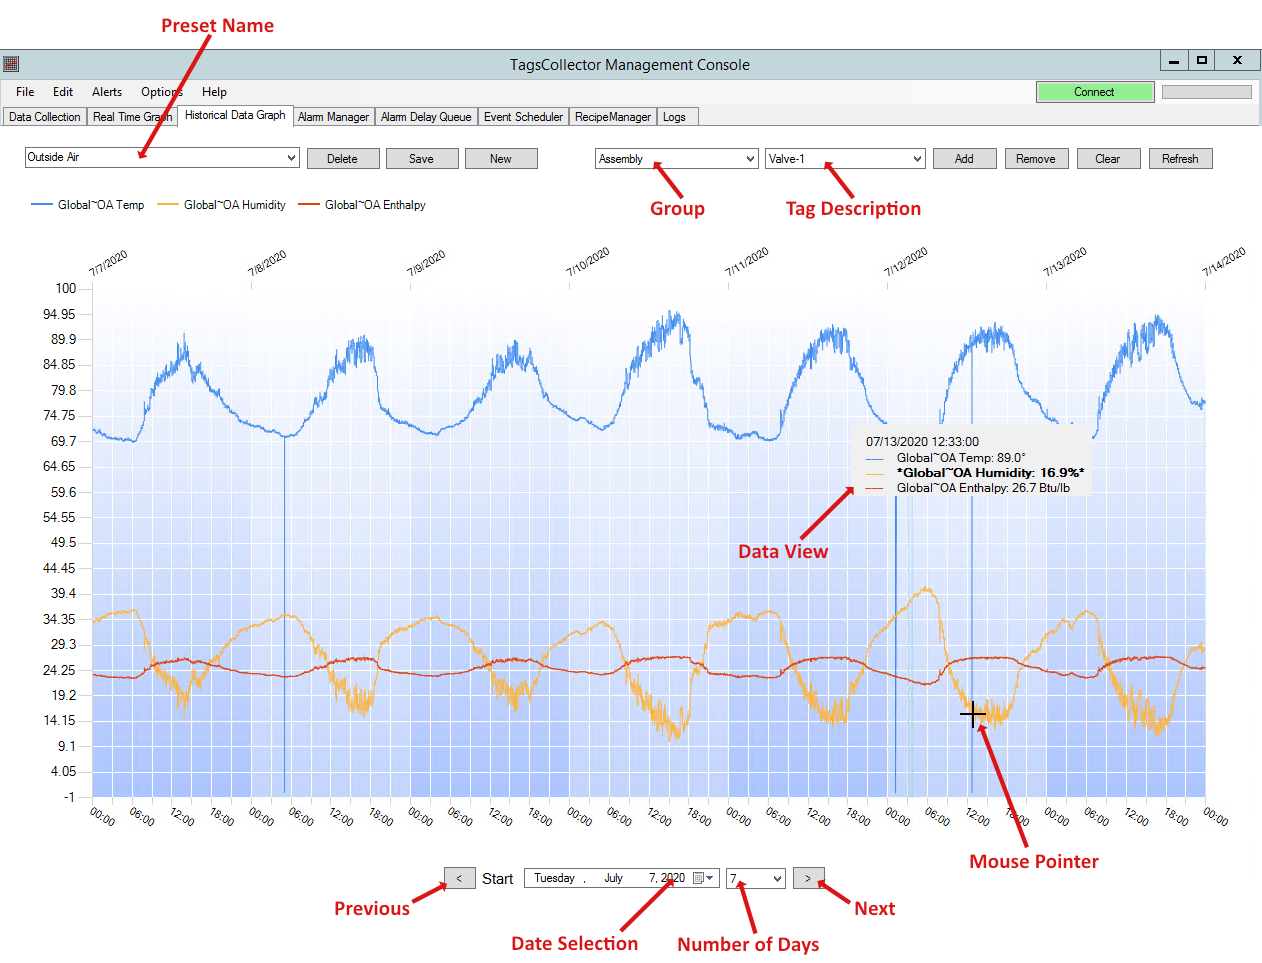
- Click the Date Selection dropdown box to open a calendar for selecting the start date of the graph
- Click the Number of Days dropdown box to select how many days will be displayed in the graph
- Click the Previous and Next buttons to move the graph forward or backward through time
III. Creating a Preset
Once pen selections have been made using the above procedure you can save the settings in a Preset for future use.
- Click the New button to create a new Preset
- Click inside the Preset Name text box and enter a name for the new preset
- Click the Save button to permanently save the new Preset
- To permanently delete a preset, first select the preset from the dropdown list, and then click the Delete button